VisualVm performance tuning tool
Comments: 2Few weeks ago I’ve got Performance Tuning Training made by Kirk. It was great time for me and great training. If you can manage such training go there. You won’t regret it. After this training I’ve got some deeper knowledge about performance tuning and performance tuning tools. One of such tool is VisualVm. If you download latest Java 6 update 14 (May 28), than you have one more option to perform application tuning. Beside of jps, jstat, jmap you get jvisualvm. The tool has long story, from NetBeans plugin to standard java tool. If you have earlier java version you can also download it separately from project page visualvm.dev.java.net .
The VisualVm developers made very good job providing plugin API. If you write any plugin for NetBeans Platform you know how to write plugin for VisualVm tool. In this post I will describe available plugins. How to install them and how to use them. The plugin menu is under Tools->Plugin. We can setup there plugins repositories. We can also manage our plugins (install, uninstall, activate, deactivate).
As I write this post currently available plugins are:.
VisualVM-Glassfish: Advanced monitoring of Glassfish server. I use Glassfish as development server in daily work and the plugin is very useful. I will not describe this plugin. It has very nice and detailed description made by Masoud Kalali.
Java ME Priofiler Snapshot Viewer : Java ME SDK 3.0 offline profiling session viewer. I’ve got very little with Java ME, so I stay just on this short description.
VisualVm-Extension : Provide support for extending VisualVM for new JDK, JVM etc. It is for extension proposes in the future.
Memory Sampler : Experimental sampling memory profiler. It’s similar to jmap -histo, an additional feature over the jmap is possibility to display delta results. If you try to find heap memory problem or PermGen space problems this tool can help you to figure out what going there.
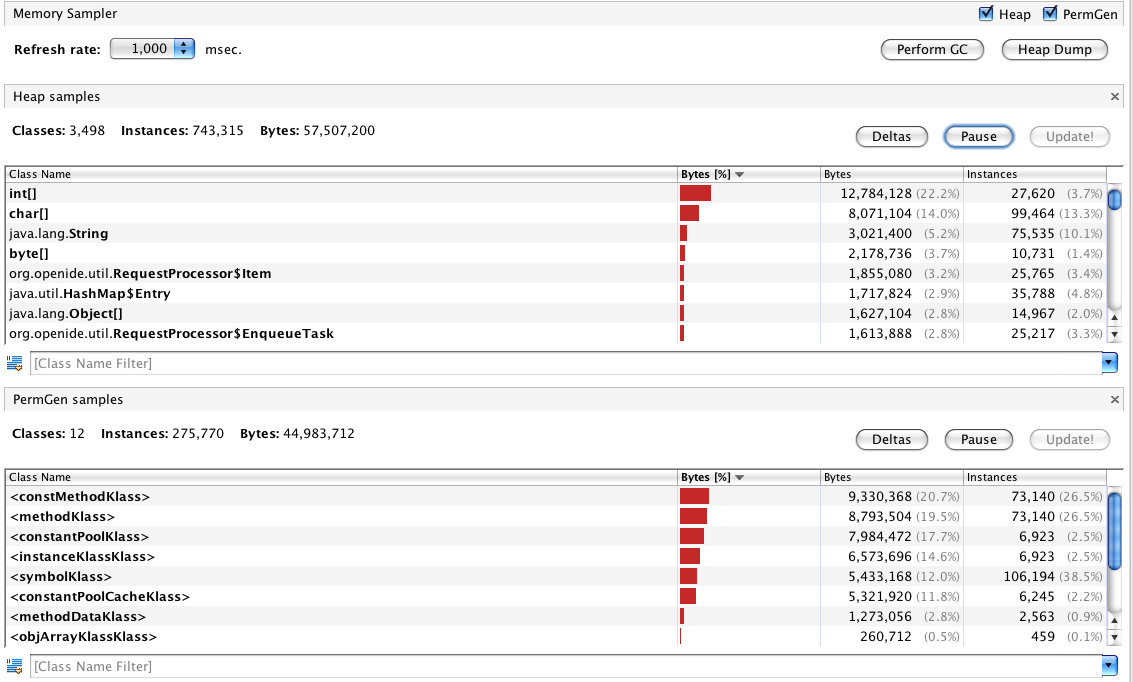
From the top on the left you can set refresh rate, on the right you can set Heap, PermGen samples and "Perform GC" and "Heap Dump" on demand. Both histograms has short information about classes, instances and overall size, and has three operation, "Pause" stops refreshing and it waits to push "Update" button, and "Deltas" switch to delta result mode. On the bottom we have filtering option to the histogram. Quite nice functionality for free.
VisualVM-JConsole: There is another command line tool called jconsole, and you can provide additional plugins for them, this plugin allows you to put the same jconsole plugin into VisualVm tool. More information.
VisualVM-MBean: MBean viewer from jconsole, You have access to all registered MBean. I assume that you are familiar with JMX and MBeans, so I just put screen shot for you.
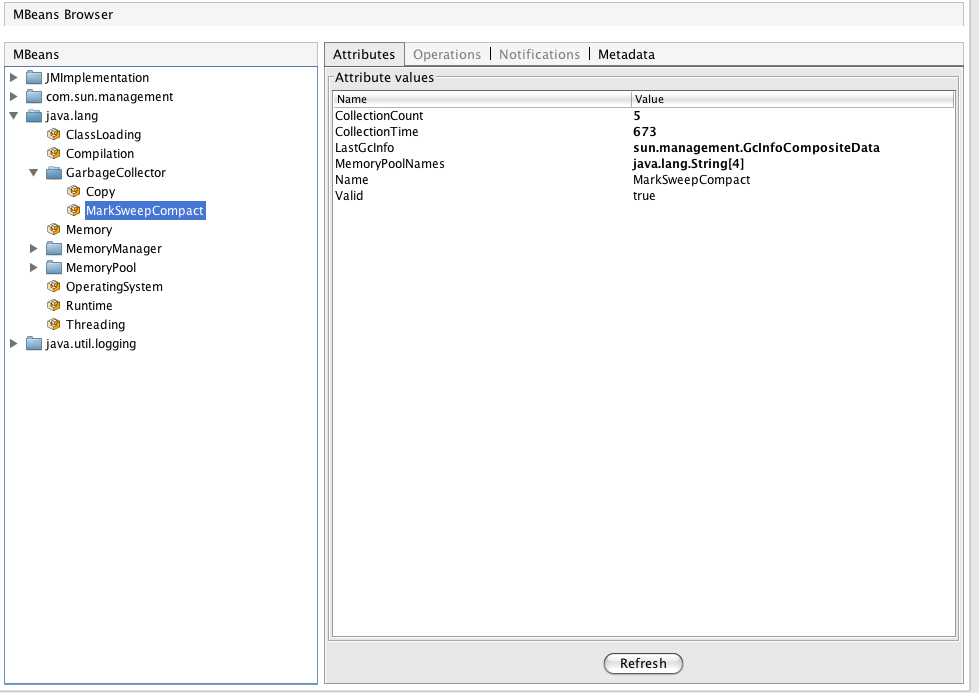
On the left is MBean tree group by MBean’s category, and on the right are MBean’s properties, grouped by Attributes, Operations (methods), Notification (if MBean defines notifications) and Metadata (all information provided with MBean).
Visual GC: Integration of the Visual GC tool into VisualVM. It is quite nice and quick view of java heap utilization, maybe it is not so detailed but you can quickly figure out what’s going on.
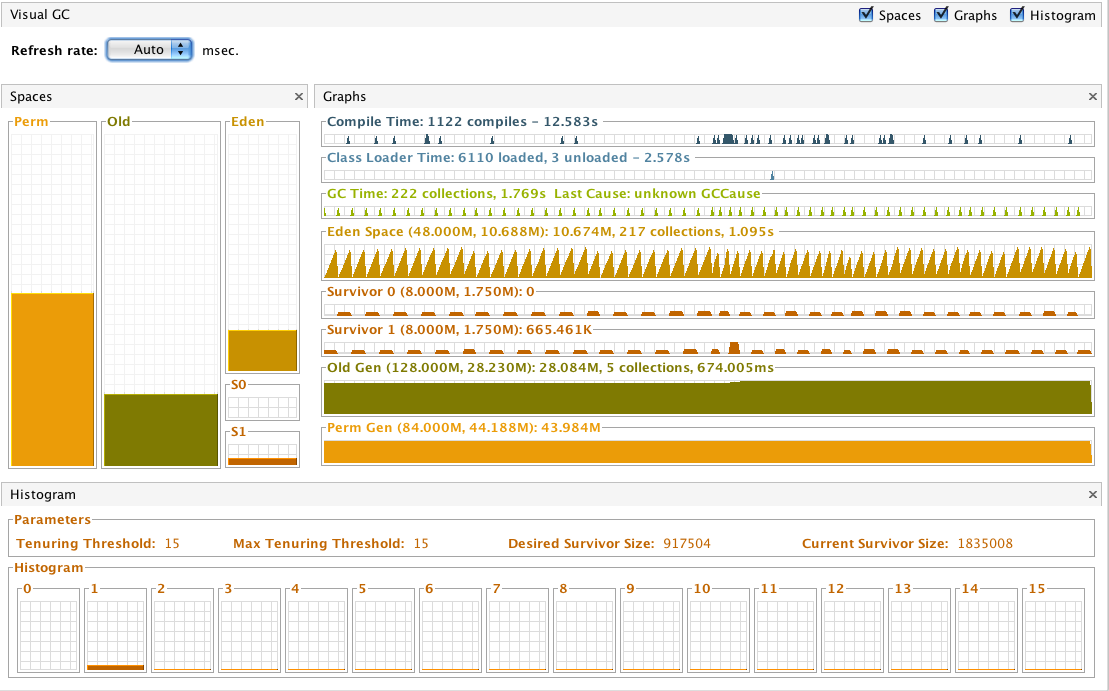
On the left we have spaces with information how full space are, on the right we have space trends and on the bottom we’ve got heap histogram.
SysTray: Allows to minimize VisualVM into system tray. Unfortunately it is not supported on Mac OS X.
KillApplication: Very simple functionality, from menu we can kill any java attached application. Just press right mouse button on the application and choose "Kill Application".
VisualVM-JvmCapabilities: Sample plugin displaying JVM capabilities in Overview tab. It is for learning proposes.
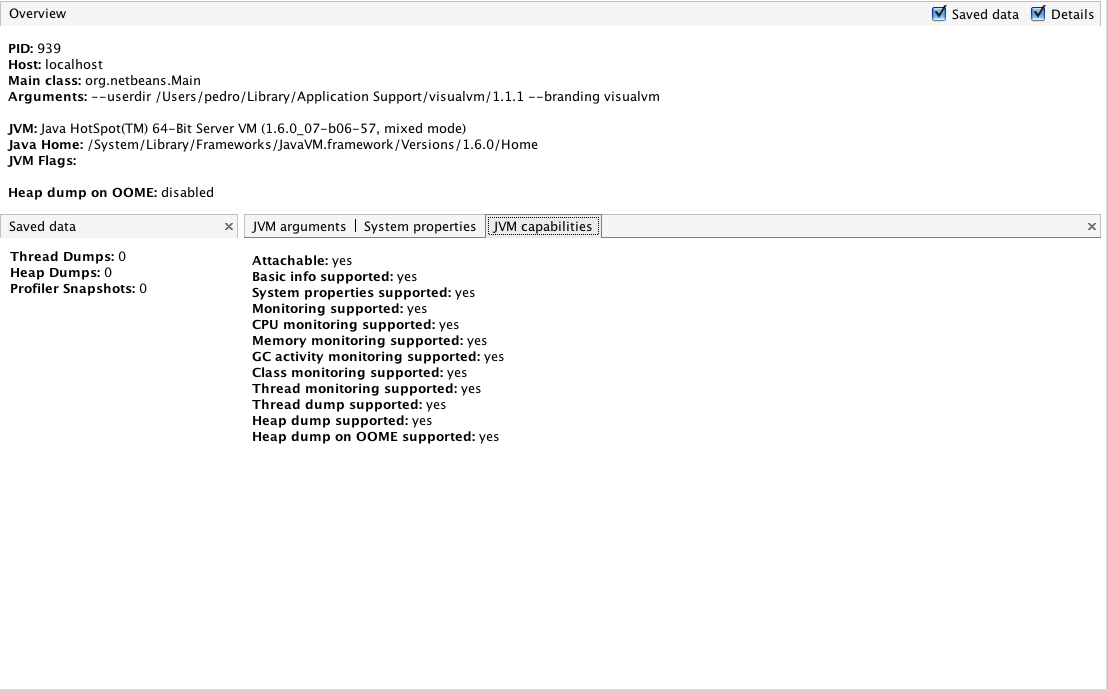
In additional tab we see more information about currently attached JVM.
VisualVm-Logfile Module: Logfile Plugin needed by TDA Plugin. Support JVM log file parsing, we can use it into our plugins.
VisualVm TDA Module: Thread Dump Analyzer Plugin. Now you can use TDA directly from VisualVm. Currently there are some problems with this plugin, but from my point of view it’s worth to manage this problems. Problems mainly are relevant for displaying properly TDA workspace. This is sample screen after manage displaying problems.
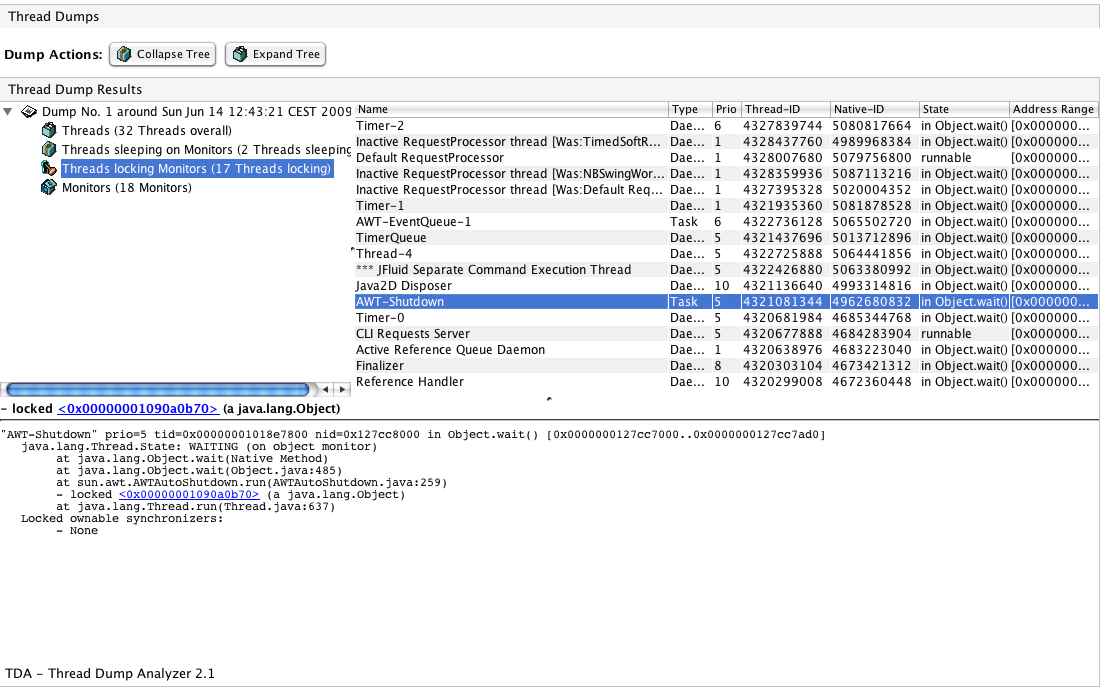
On the top you have to action button, they are responsible for Thread Dump tree operation. In the upper left corner you have standard TDA thread groups with monitors. On the right TDA displays current chose group and on the bottom TDA display current chose thread. The great thing is that in thread panel you can pressed "Thread Dump" button and after that you simply select Thread Dump and TDA is opening automatically. Great tool.
Is this all ?!?
In fact no. Of course you can look around jconsole plugin or write it by ourselves. Another option is to write by ourselves VisualVm plugin which can be very easy task due to VisualVM Sample Collection. This is a collection of NetBeans example projects which are VisualVM plugins. There are also some others sample projects, you can find them here. Also VisualVM team provides great information how to start with VisualVM API.
Currently there is under development a plugin to Garbage Collection Histogram Tool. Another Plugin in development is BTrace plugin. We can install it by adding additional VisualVm plugin repository. All the information is provided for you here.
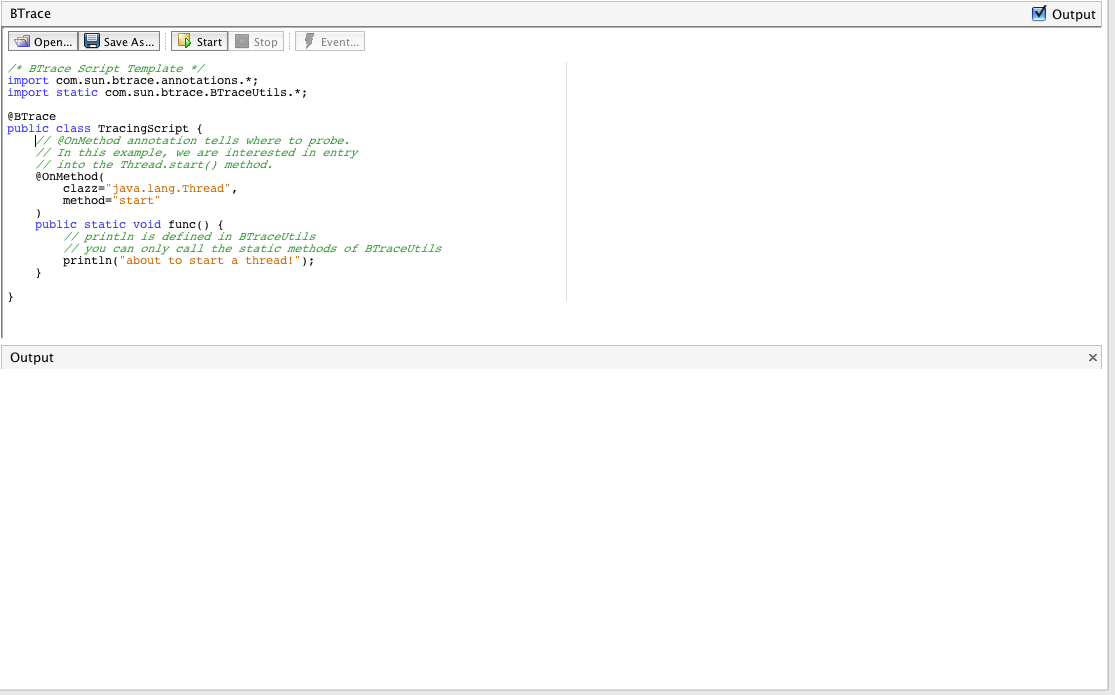
You can write BTrace script to find out what’s going on. User Guide is here.
With GHisto is more work to do. The team is working hard, actually you can download GCHisto. You download and run it by java -jar command.
, I’m still waiting for the VisualVM plugin.
Conclusion
I install all of this plugins, and I disabled SysTray and JavaME Profiler. I put it on the USB stick and have always with me. Unfortunately it works the best with Java 6, so if you have legacy systems it will be hard to use all the features. Also if you go into problems such as this:
Profiler Agent: JNI On Load Initializing...
Profiler Agent: JNI OnLoad Initialized succesfully
Profiler Agent: Waiting for connection on port 5140 (Protocol version: 8)
Profiler Agent: Established local connection with the tool
#
# An unexpected error has been detected by Java Runtime Environment:
#
#  EXCEPTION_ACCESS_VIOLATION (0xc0000005) at pc=0x6ddc1475, pid=2768, tid=4136
#
# Java VM: Java HotSpot(TM) Server VM (11.3-b02 mixed mode windows-x86)
# Problematic frame:
# V  [jvm.dll+0x291475]
#
# An error report file with more information is saved as:
# c:\development\svn\unite-trunk\hs_err_pid2768.log
#
# If you would like to submit a bug report, please visit:
#   http://java.sun.com/webapps/bugreport/crash.jsp
#
Check if both Application and VisualVM work on the same JVM. I get this error due to run application on Java 6u13 and VisualVM running on Java 6u14.
Comments
Your article is really exciting, I like it, I hope you can be properly update your zoom.
If you haven’t resolved the 0xc0000005 error yet… 0xc0000005 has always something to do with wrong memory usage. As I understand, you haven’t installed new RAM modules, so this is not the cause. Try to define DEP exception for the problematic application (DEP is a Windows security feature that prevents execution of suspicius applications, set exceptions only for trusted programs!) or clean registry. Hope that helps.